


Integrating innovations and requirements from real life experience is the hallmark of both the EnEffCo® software platform and also the consulting services of our efficiency experts. As an EnEffCo® customer, you receive regular software updates that include new features, optimizations and the latest programming developments. Optional modules and services allow you to flesh out your EnEffCo® installation to meet your energy and resource needs.
Mobile App
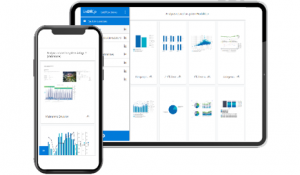
With the mobile app, you have access to your EnEffCo® installation anytime and anywhere. View analyses and reports with your mobile device or call them up directly during a plant tour. The responsive design enables a display on tablets and smartphones of all sizes. Another plus: Manual data entry can be performed directly via the mobile app and the values are stored directly in your system. This saves time and digitizes your data gathering process.
Heat Map
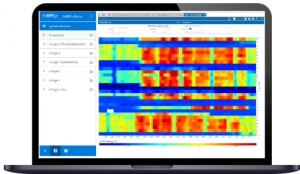 Analyze irregularities or possible malfunction of equipment and processes with the Heat Map, identifying potential savings. The Heat-Map, also known as Carpet Plot, is a type of diagram that can be used to identify load peaks or recurring events at a glance. The two axes represent the time dimension (date and time of day). Assigned measure values are made clear via the color scale: The values of the selected datapoint are displayed in color over the period of one month at a resolution of 15 minutes.

Sankey Module
With the Sankey diagram, you can graphically represent quantity flows and visualize complex issues in a graphic with just a few clicks. For example, use it to visualize the energy from an electric grid, the distribution of your energy costs or the energy purchased per location. Dynamic adjustment of evaluation period and individually definable level of detail also allow customized diagrams – depending on user groups or specific needs.

Smart Process Editor
Our Smart Process Editor tool has proven to be very suitable in various projects to create time-saving evaluations, displays and reports e.g. for CO2 and energy balances of overall and partial systems, as well as evaluations of CO2 emissions by client site, product, process or technology.
Via a graphical input option, the datapoints of the system inputs and outputs, as well as the prices of the inputs can be assigned by “drag and drop”. The calculation and display are performed automatically. On the one hand, this saves users time and, on the other hand, the tool enables the mapping of networked, complex systems or processes.

Ticket System Module
Alarm messages from smart chart analyses can be registered, tracked and processed via a defined process with the new “Ticket System” module in order to initiate targeted countermeasures for better efficiency. Additional consumption and costs can thus be kept to a minimum.
The process defined in the ticket system enables energy efficiency to be restored in a structured manner. The system also functions as a library, documenting proposed measures for rapid root cause identification. The system can be individually configured for your processes, systems and requirements, and includes functions such as the task planner and task tracking for control and follow-up.
Would you like to learn more about EnEffCo®’s features and modules?
We will be happy to answer your questions.